
What is Graphs?
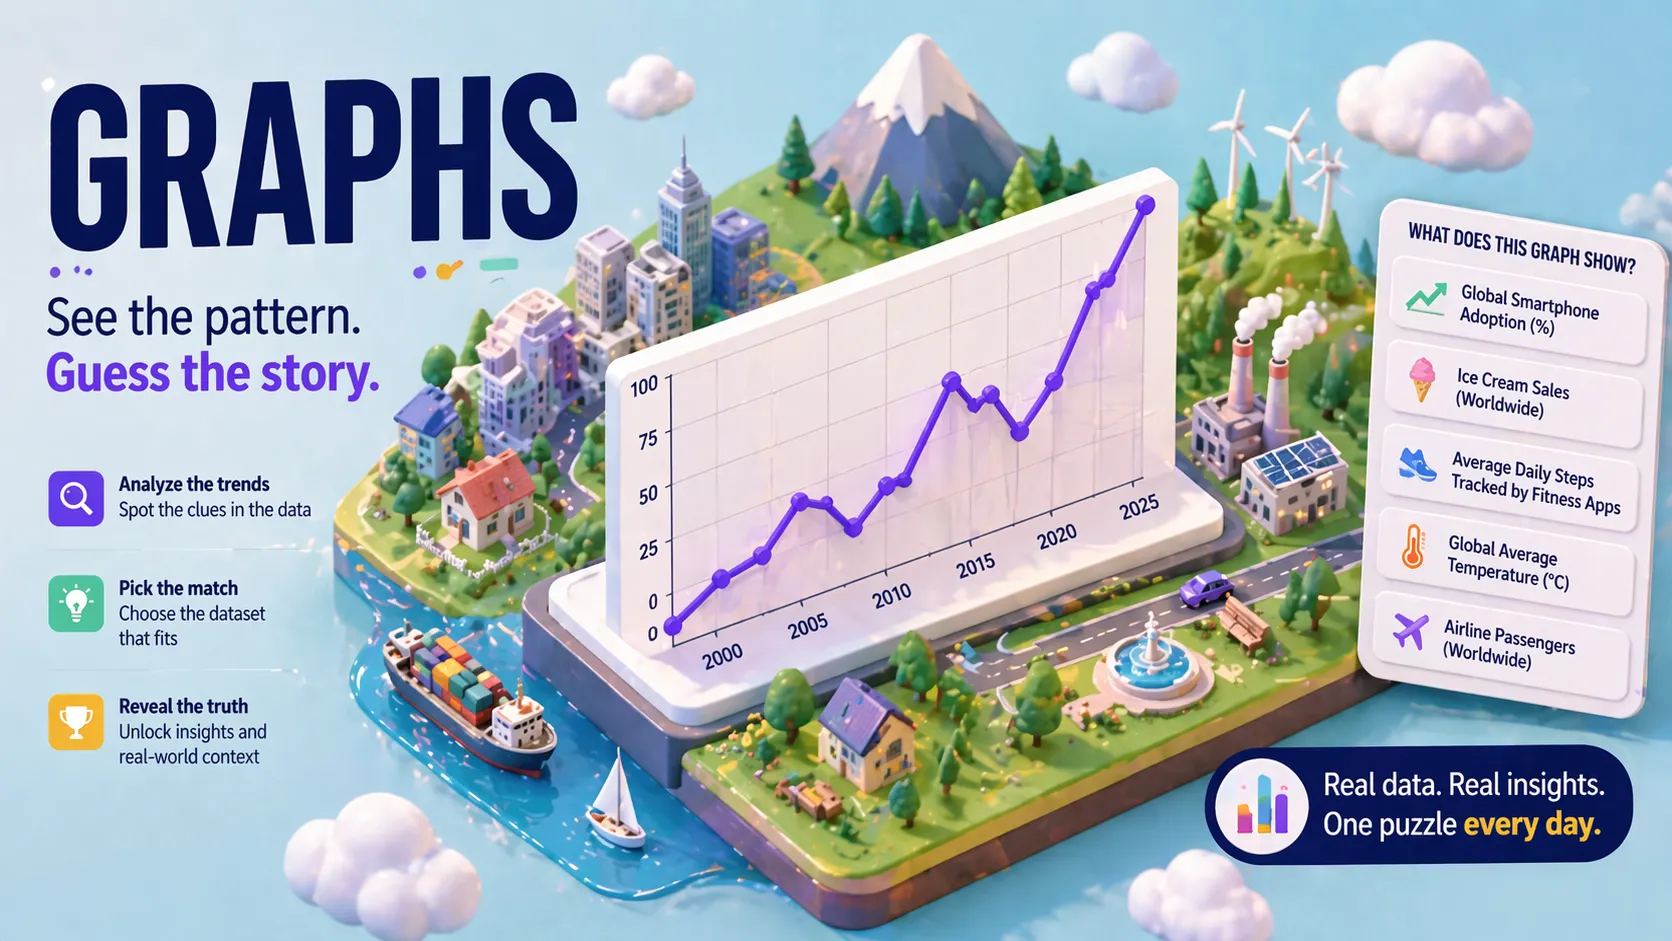
Graphs is a daily data-ID on graphs.world. You see a real line chart with no title and no legend: axes, a curve, spikes, flats. Beside it sit a handful of dataset names. You pick which public statistic actually drew that line. Typical boards give about three tries. A hit unmasks the source; a miss knocks out a decoy so the remaining stories have to fit the same kinks.
It is not Chartle, where you type the country of a highlighted red series. Graphs is multiple-choice matching: shape versus real-world history, not a blank country field.
Graphs Game Rules
One unlabeled chart per day, drawn from real numbers. Choose among the listed datasets (often three to five). Wrong picks are eliminated. You usually have three selections before the puzzle locks. After you finish, the site can show the full series and where the data came from. New Graphs drop around midnight Eastern. Invented curves are not the point; the trap is two options that both “go up.”
- Match Graphs’ nameless line to the correct real dataset.
- Pick from the listed options; misses remove a title.
- About three tries on a typical Graphs board.
- A new real-world chart appears each day.
How to play Graphs?
Press Play on this listing to open official Graphs. Read the time span and scale first, then ask which listed story could produce that exact crash or plateau.
- Scan Graphs’ axes: years, units, and whether the line is a count or a rate.
- Mark signature moves: exponential climb, seasonal waves, a 2020 cliff.
- Choose the dataset whose history matches those moves.
- On a miss, reread the leftover titles against the same shape.
Graphs Strategy & Tips
Units and era beat vibes. A per-capita series is not the same as a raw total. Pandemics, recessions, and tech adoption leave fingerprints. If two options both rise, the timing of the kink usually decides. Ignore a single outlier until the overall story is named. Graphs rewards people who remember what actually happened in the world, not people who guess “something about phones.”
- Parse scale and dates before you tap a Graphs option.
- Match events to kinks, not to a generic upward slope.
- Use each miss only to delete a story that cannot fit the curve.
FAQ about Graphs
What is Graphs?
Graphs is a daily puzzle: an unlabeled real line chart plus a short list of datasets; you pick which statistic the curve actually is.
How do you play Graphs?
Open official Graphs, study the shape and axes, select a dataset title, and use misses to eliminate options until the match is clear.
Is Graphs the same as Chartle?
No. Chartle asks you to name a country on a multi-series chart. Graphs asks which listed real-world dataset produced a nameless line.
Where can I play Graphs?
Use Play on this AllDle Games page to open official Graphs in a new tab.